Continuous monitoring of outer Sistema Solar provides fundamental data on the formation and evolution of the ice giants that orbit Sol at extreme distances. The application of advanced image processing techniques to space photographic records allows the visualization of meteorological phenomena that completely escape the capacity of human vision. The use of false color in astronomical photographs acts as an essential analytical tool, translating invisible wavelengths into clear visual information about the chemical composition and dynamics of planetary gases. The detailed recording of Urano demonstrates how the combination of multiple optical filters can expose a complex atmosphere, full of cloud formations, localized storms and intense seasonal variations. The original capture, obtained by high-precision instruments operating in Earth orbit, demystifies the idea that the seventh planet of Sistema Solar is just a static sphere without notable features. In-depth analysis of the reflection of sunlight in the upper layers of the atmosphere reveals a world in constant transformation, driven by internal forces and its peculiar orbital orientation. Mapping these hidden structures provides the empirical basis necessary for improving climate models applied to distant celestial bodies. Visual decoding of equatorial bands and polar vortices establishes a new paradigm in understanding extraterrestrial meteorology.
The processed visual representation exposes striking differences in the hue and structure of the air masses that cover the planet. The data combines observations in different light spectra, highlighting the direct consequences of the extreme axial tilt of almost 98 degrees that characterizes the gas giant’s rotation. Essa unique orbital configuration subjects the hemispheres to prolonged periods of continuous insolation or total darkness, generating a thermal imbalance that drives global atmospheric circulation.
The filter overlay technique reveals specific characteristics of local climate dynamics, highlighting elements that define the planet’s meteorology. The processing of information captured by space sensors allows the following structural patterns to be identified:
– The marked asymmetry between the southern and northern hemispheres, reflecting intense seasonal variations.
– The alignment of bands of clouds and fog that extend parallel to the equator.
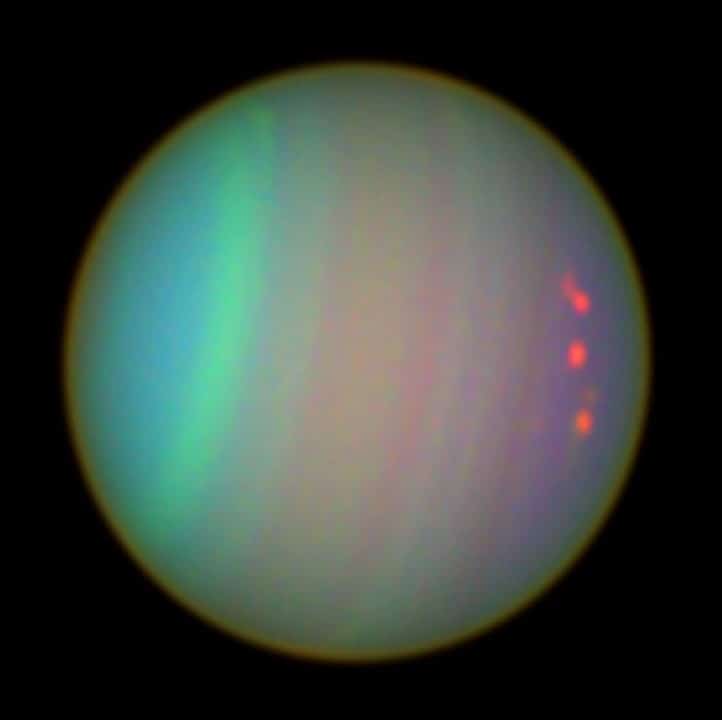
– The presence of bright, reddish spots that contrast strongly with the background darkened by the absorption of methane gas.
Meteorological dynamics hidden beneath the bluish surface
The false color image shows with extreme clarity the contrast between the different regions of the planet. Essa difference in color and brightness results directly from the severe seasonal variations that the celestial body experiences throughout its extensive orbit around Sol. The asymmetry observed between the poles and the equator is associated with complex thermodynamic processes that occur over decades in the hostile environment of the distant planet.
Additional observations indicate that the atmosphere has bands of clouds perfectly aligned with the equator, forming a zonal circulation pattern similar to that found in Júpiter and Saturno, although less pronounced in visible light. Essas formations appear parallel and reveal internal heat transport dynamics that are not apparent in conventional photographic images. Careful processing of the light filters helps map these aerosol layers with a level of precision unprecedented in observational astronomy.
The natural blue-green hue, resulting from the presence of methane in the upper atmosphere, acts as a veil that hides the true turbulence of the lower layers. Mathematical removal of this natural filter, through the selection of specific wavelengths, exposes the true face of the ice giant. The banded structure suggests the existence of strong zonal winds that distribute thermal energy unevenly, creating zones of high and low pressure that govern the global climate.
Convective formations and methane absorption
Three red dots visible near the edge of the planetary disk draw the immediate attention of researchers and space data analysts. Essas isolated structures correspond to individual, highly active cloud formations in the upper atmosphere. The reddish appearance arises exclusively from the combination of optical filters that include wavelengths where there is strong absorption of light by gaseous methane.
Clouds that reach high altitudes in the troposphere reflect a greater amount of sunlight before it can be absorbed by the surrounding methane, standing out as bright spots against the surrounding dark atmosphere. The formation of these clouds is directly connected to vigorous convective activity that originates in the planet’s warmer, deep interior. Esse physical process lifts fresh material and ice crystals to the highest, rarefied layers of the atmosphere.
Evolution of observations since the first missions
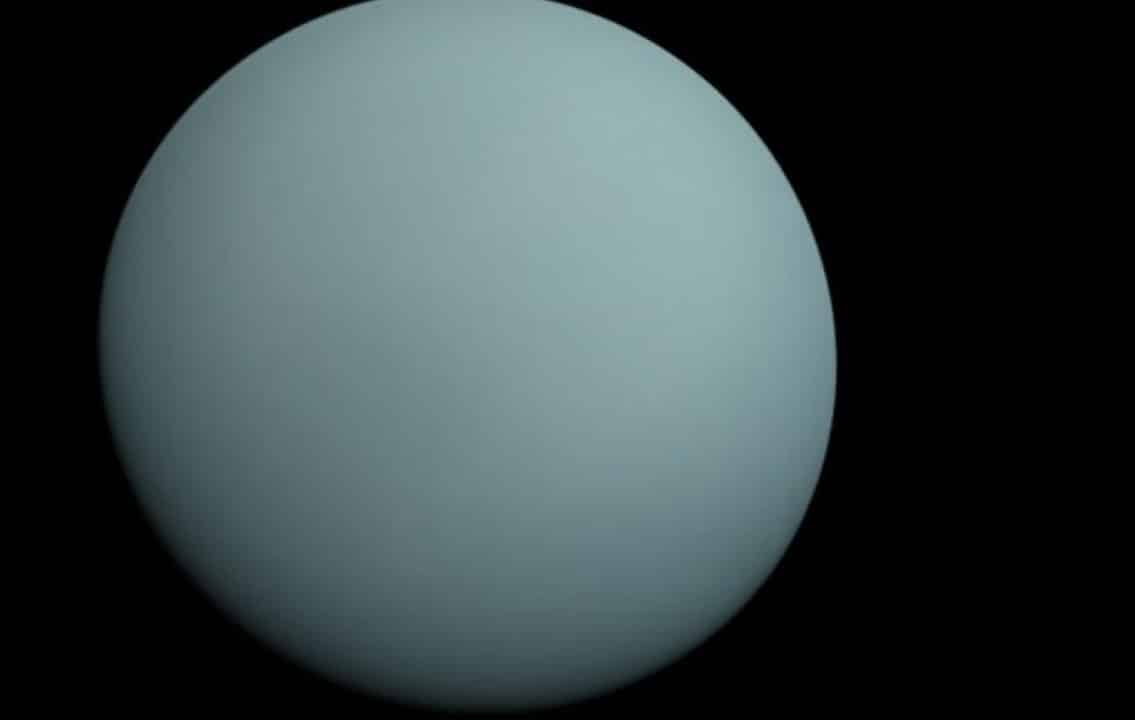
The passage of the space probe Voyager 2 in 1986 recorded an atmosphere that appeared visually monotonous, relatively flat and without major meteorological highlights. At Naquela time, the planet displayed a smooth, bluish face, which led to initial assumptions about widespread climate inactivity. The instruments of the time captured the southern hemisphere in midsummer, under specific lighting conditions.
Later images captured by space telescopes and large ground-based observatories showed a radically different picture. Clouds arise, evolve and dissipate repeatedly and dynamically over time. The change of season, as the planet progresses in its 84 Earth-year orbit, has revealed latent atmospheric activity that was just waiting for the right lighting conditions to manifest.
The contrast between historical data and modern observations underscores the importance of continuous long-term monitoring. The evolution of optical sensor technology and image processing algorithms has allowed the scientific community to review fundamental concepts about the physics of ice giants. The transition from a static view to a dynamic model represents a milestone in the exploration of the outer Sistema Solar.
Recent advances in the analysis of the upper atmosphere
Data accumulated over the last few decades indicate much greater variability in the atmosphere than was imagined in the early days of space exploration. Systematic monitoring recorded the appearance and disappearance of bright storms at different latitudes and periods. Essas observations reveal a celestial body with incredibly active internal dynamics, capable of generating meteorological systems the size of Earth’s continents.
Recent studies complement historical captures with new perspectives on the upper layers and their interaction with the space environment. Providing detailed representations of the vertical structure of the upper atmosphere, including precise data on the density and temperature of the ionosphere, has added a new layer of complexity to the study of the planet. The ability to observe direct thermal emission has opened new avenues for planetary research.
Combining information from different generations of space instruments makes it possible to clearly understand the physical processes that govern extreme weather. The bright spots identified in the processed images serve as crucial markers of regions where significant convective uplift occurs. Tracking these formations helps calculate wind speeds and the direction of jet streams.
Integrating data at multiple wavelengths, from ultraviolet to mid-infrared, builds a three-dimensional model of the atmosphere. Analysis of the distribution of trace gases and the formation of photochemical aerosols provides clues about the composition of the planetary core and the history of its formation. The complex meteorology observed is a direct reflection of the internal energy remaining from the time of the formation of Sistema Solar.
Filter technology applied to data capture
The joint use of advanced cameras for research and high-resolution imaging spectrographs was essential for generating the raw data that make up the final image. Cada optical filter positioned in front of the sensors captures highly specific information about the reflection and absorption of light at different altitudes in the gas column. Isolation of precise spectral bands allows slicing the atmosphere into virtual layers for independent analysis.
The end result combines these individual signals into a unique visual representation that reveals the true complexity of atmospheric stratification. False color processing does not alter the physical reality of the phenomena, but acts as a visual translator, facilitating the interpretation of variations in density and composition. Essa analytical technique remains an essential and irreplaceable tool for the detailed study of distant planets and exoplanets.
Extreme seasonal variations of the ice giant
The detailed observations remain absolutely relevant for current studies on climate evolution in microgravity and extreme cold environments. Elas serve as a historical basis for comparing the drastic changes that occur throughout the planet’s seasons, which last more than two Earth decades each due to the long orbital year. The tilt of the axis causes the poles to receive continuous sunlight for 42 years, followed by 42 years of deep darkness. Esse asymmetric heating and cooling generates temperature gradients that fuel massive storms when sunlight reaches equatorial regions during the equinoxes. Continuous monitoring of these seasonal evolutions is strictly necessary to refine the mathematical models that predict the behavior of atmospheres rich in hydrogen, helium and volatile compounds under conditions of variable irradiation.
Continuous mapping of global circulation
Using light contrast differences makes it possible to map the exact distribution of aerosols and gases in the upper atmosphere. The red dots precisely indicate locations where high clouds surpass the general methane absorption line, offering valuable insights into global atmospheric circulation and momentum transfer between different latitudes.
Wind speed and mass movement
The clouds highlighted in the processed images circle the globe at extremely high speeds in some specific regions. Measurements derived from sequences of temporal observations indicate that this rapid movement is driven by strong zonal winds acting at different layers of atmospheric pressure.
Analysis of the displacement of these cloud formations over days and weeks allows us to calculate the force of Coriolis applied to the planetary environment. Integrating all of this observational data helps build a complete meteorological picture, revealing that beneath the placid appearance lies a vigorous, constantly churning weather system.