Satélites and Nasa captured images showing the surface of Terra illuminated by artificial light at night. A recently published study analyzed this data and showed a 34% increase in global radiance during the period evaluated. The research covered nine years and highlighted striking regional variations.
The work brought together more than 1.16 million images collected every day by VIIRS sensors on board satellites. The captures occurred around 1:30 am local time. The equipment, the size of a refrigerator, orbits the planet at more than 25,000 km/h and detects light in wavelengths ranging from visible to infrared.
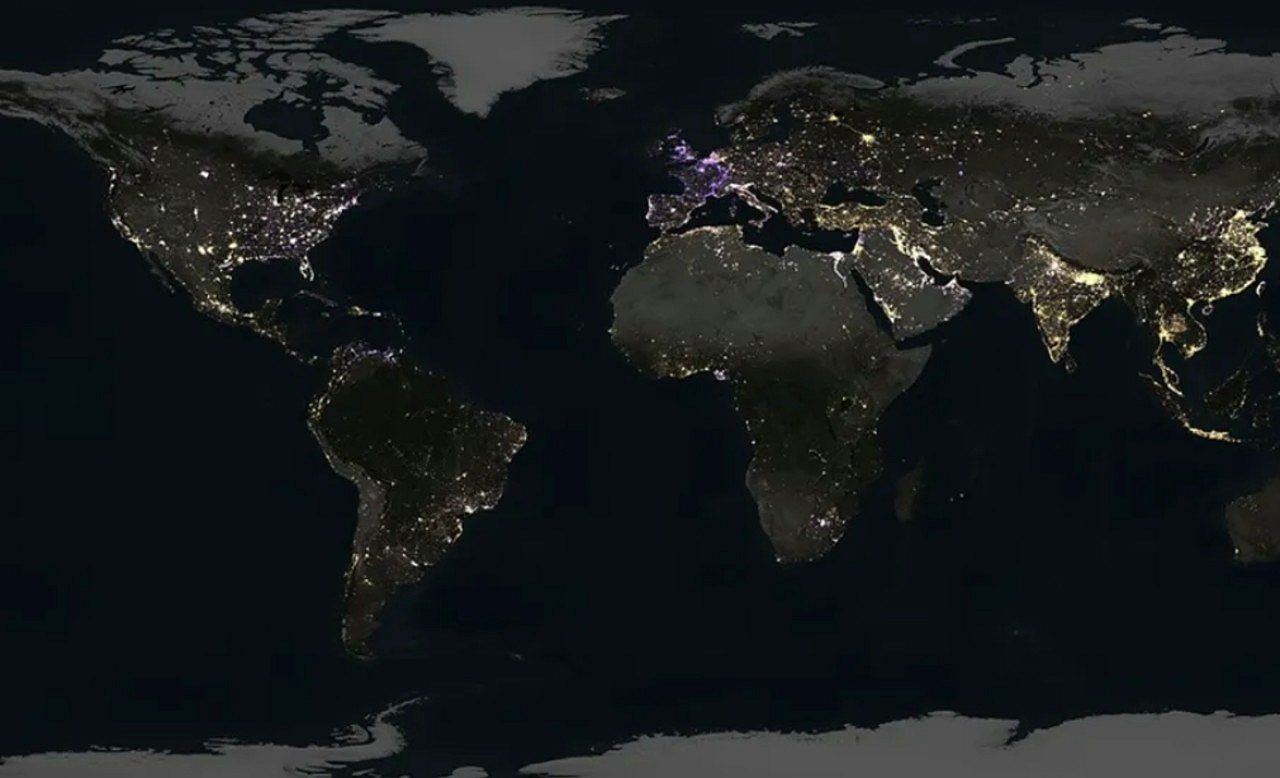
Imagens reveals growth of artificial light on a global scale
The analysis indicated that total nighttime brightness increased by a net 16%. Technological advances in the production of oil and natural gas helped to explain part of this movement, especially in the central region of the Estados Unidos. Expanding Cidades and more robust power grids also contributed.

Regiões of Ásia recorded the biggest gains. China and northern Índia led the increase in artificial luminosity. The phenomenon reflects accelerated urbanization and greater energy consumption in these areas.
- China and north of Índia showed the highest increases in nighttime light
- Avanços in oil and gas extraction boosted brightness in parts of Estados Unidos
- Sensores VIIRS allowed mapping daily changes with fine resolution
- New Algoritmo processed the data to separate abrupt from gradual variations
The researchers developed a specific algorithm to process daily images. Isso allowed us to identify rapid changes that previous annual compositions did not capture. The result offers a more dynamic view of human activity.
Algumas areas of the planet registered a reduction in luminosity
Países from Europa showed a drop in nighttime brightness. França had a reduction of 33%, Reino Unido of 22% and Holanda of 21%. Medidas energy efficiency and light pollution policies explain part of this decline.
The zone between Ucrânia and Rússia also showed a decrease. The armed conflict directly influenced the lighting pattern in the region. Esses instances of dimming partly offset growth seen elsewhere.
The study followed the period from 2014 to 2022. Cada location that changed recorded an average of 6.6 distinct changes over the nine years. Volatility increased especially after 2020, with impacts from economic and health crises.
Nocturnal Luz serves as an indicator of human activity
Cientistas uses artificial glow to track the flow of energy through electrical grids and supply chains. The method works in real time and reveals patterns that traditional data does not show.
The Universidade team from Connecticut led the work in partnership with Nasa. The sensors are part of the Black Marble project, which processes information to generate global visualizations.
A longer paragraph helps contextualize the scope of the search. Satellites operated jointly by Nasa and NOAA provide nearly complete coverage of the inhabited Terra. Cada pixel covers about 500 square meters. The accuracy allows it to detect small light sources, such as toll booths on dark roads.
Essa daily approach overcomes limitations of monthly or annual images. Ela captures fluctuations linked to specific events, such as construction, blackouts or political changes. The dataset paves the way for studies on urban evolution, energy transition and ecological effects of nighttime lighting.
Volatilidade marks the pattern of changes in lighting
The 34% gross increase in radiance was partially offset by an 18% reduction in areas that darkened. Essa dynamics create a “beating heart” effect on the planet, according to the authors. Regiões with intense growth coexist side by side with others in decline.
The research highlighted that both lightening and darkening have intensified in the last decade. Fatores such as urbanization, public policies and global crises explain the fluctuations. The work was published in the magazine Nature and included collaboration with Estados Unidos and Alemanha institutions.
The final image produced by the satellites shows a planet with sharp contrasts. Golden Áreas indicates a strong increase in light, while purple tones mark regions that have lost brightness. White Zonas records locations that underwent both movements in the period.
Esses maps help you better understand how human activity is distributed during the night. Eles also serve as a tool to monitor environmental and social impacts of the expansion of artificial lighting.