Global forecast: map indicates urban and agricultural expansion on the planet in 2050

An online platform developed by geospatialization experts offers detailed visualization of how the planet will transform over the next 26 years. The interactive map allows you to explore changes across entire continents or specific regions, revealing profound changes in land cover due to urbanization, agriculture and global warming.
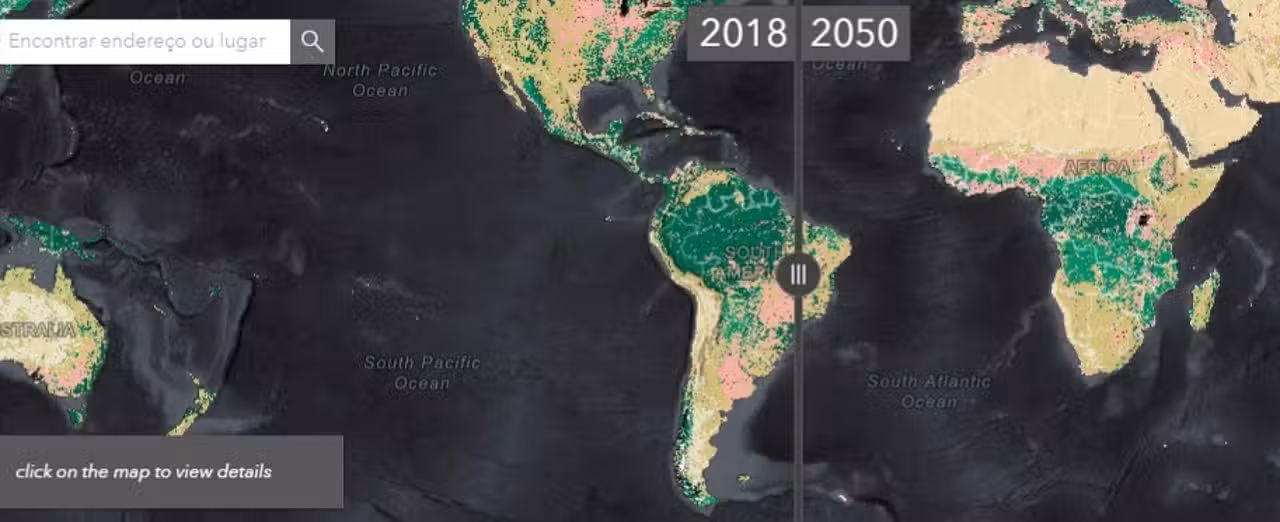
Como works the visualization tool
Esri, a leading geospatial technology company, collaborated with researchers at Universidade Clark to create the map. The project uses a vertical slider that facilitates comparison between current land coverage and projections for 2050. Sua clear graphical interface and intuitive menu allow any user to explore complex data without difficulty.
The development of the tool considered two pillars: historical data on land transformations and the speed of changes over time. Imagens satellite captured by Agência Espacial Europeia over decades provided the scientific basis. With this information, creators built predictive algorithms capable of projecting future patterns with relatively high accuracy.
Embora seem decades away, the changes visible on the map are impressive in their magnitude. Entire Florestas may disappear. Áreas agricultural expand. Coastal Regiões face inexorable threats. The contrast between the present and 2050 reveals transformations that redefine geographic landscapes.
The visual language of the map: colors that tell stories
Cada color represents a specific land cover type, allowing quick reading and immediate visual interpretation:
- Rosa indicates predominantly agricultural areas
- Amarelo marks grasslands, thickets and shrubs
- Verde clear shows deciduous forests (which lose leaves seasonally)
- Dark Verde represents coniferous and evergreen forests
- Cinza-whitish signals sparse or rare vegetation
- Bege marks areas completely devoid of vegetation
- Menta identifies frequently flooded or swampy regions
- Vermelho highlights urbanized areas and artificial surfaces
The color palette was developed to facilitate quick comparisons. A trained observer can identify patterns of forest loss, urban expansion and agricultural transformation in seconds. Essa visual clarity makes the map a powerful educational as well as scientific tool.
Polônia in transition: what the Polish coast will face
Scientists have identified the Polish coast as one of the regions most vulnerable to changes predicted by 2050. Áreas Current green areas could be replaced by new agricultural zones or landscapes transformed by urbanization. Rising sea levels — a direct consequence of global warming — represent a concrete threat to multiple European coastal regions.
Polônia serves as an illustrative case study of the global phenomenon. Embora Although the European country has maintained less direct human impact in certain regions compared to densely urbanized areas, no geography escapes future pressures. Population growth, agricultural intensification and technological development will demand new land and resources.
The Polish coastline already faces significant coastal erosion. Map projections suggest this trend will accelerate. Cidades ports, coastal ecosystems and infrastructure built along the coast can suffer severe impacts. Investimento on coastal adaptation and resilience emerges as imperative for European nations.
The drivers of transformation: technology and climate in conflict
Dois factors dominate future modeling: technological advances and climate change. Ambos will shape the planet in interconnected and often contradictory ways. Technology promises solutions, but it also consumes land and resources. Climate changes independently of human intentions, forcing cascading adaptations.
Accelerated Urbanização transforms rural landscapes into dense metropolises. Industrial Agricultura expands its borders, consuming primary and secondary forests. Desmatamento continues apace in tropical regions. Simultaneamente, changes in global temperatures alter precipitation patterns, crop viability, and ecosystem distribution.


The interaction of these forces creates complex scenarios. An area can go from forest to agriculture in ten years, then to urbanization in another few decades. The cycles accelerate. Changes that took centuries in previous eras now occur in periods of one human generation.
Vulnerabilidade from historically untouched regions
Universidade Clark experts highlight a disturbing paradox: places that have experienced the least human impact to date will face radical changes over the next 26 years. Essas regions do not have adaptive infrastructure, accumulated mitigation knowledge, or resources to respond quickly.
Florestas primary tropical, little-disturbed savannas and subarctic tundra, landscapes that seemed remote and protected, will suffer simultaneous pressure from three vectors: agricultural expansion, migratory urbanization and direct effects of climate warming. Specialized Ecossistemas will face obsolescence. Espécies will face unprecedented habitat loss.
Paradoxality reveals the planetary scale of the phenomenon. Nenhuma region is untouched. Nenhuma geography remains stable. The question is no longer whether there will be changes, but how communities, nations and civilization will adapt to the speed and magnitude of transformations.
Acessibilidade and practical use of the map
The platform is available for public access online, democratizing data that previously remained restricted to research institutes. Educadores use the tool in geography and climate change classes. Planejadores urban residents consult projections to anticipate future pressures. Ambientalistas monitor transformations in critical ecosystems. Jornalistas uses visualizations to contextualize reporting on climate and development.
Intuitive design removes technical barriers. Não GIS (geographic information systems) experience is required to explore data. Usuários beginners can navigate, compare regions, and extract insights in minutes. Visual clarity transforms scientific complexity into accessible understanding.
Múltiplas geographic perspectives emerge from interaction with the map. Residentes from Polish coastal areas see direct threats. Agricultores Brazilians observe changes in agricultural viability standards. Planejadores Indian urbanites assess future pressures on megacities. The tool works as a collective mirror of the shared future.
Scientific Metodologia that supports the projections
Predictive algorithms are based on historical patterns of change. The speed at which forests were converted to agriculture in a decade provides a basis for projecting future transformations. Dados Historical climate data, combined with atmospheric circulation models, inform where agricultural viability will increase or decrease.
High-resolution satellite Imagens captures pixel-scale changes. Computadores processes billions of data points, identifying patterns that would otherwise escape visual analysis. Machine learning continually refines projections as new satellite data arrives.
Uncertainties remain significant. Políticas future climate conditions may alter trajectories. Inovações technologies can slow down certain processes. Comportamentos collective humans still offer room for intervention. The map does not predict an inevitable future, but shows extrapolated current trends.
See Also em Latest News (EN)

IOS 26.5 Beta 4 is now available with performance and RCS improvements
02/05/2026
Kathy Hilton denies responsibility for guest’s fall at Bel Air mansion
02/05/2026
Apple ends Intel support in macOS 27 and kills Rosetta 2 in September
02/05/2026
Tesla Model X leads used car market in the US with sales in 25.6 days
02/05/2026
Berkshire Meeting Reveals Changing Era with Greg Abel Featured in Omaha
02/05/2026
Berkshire Hathaway reduces attendance at annual shopping event, with Greg Abel in the spotlight
02/05/2026
Gas over $8 makes Los Angeles drivers spend $100 per fill-up
02/05/2026
Nintendo announces nine releases for Switch 2 and Switch in May 2026(99)
02/05/2026
Crimson Desert receives update 1.05 with rematch mode and new challenges
02/05/2026
Samsung regains leadership in smartphones with Galaxy S26 in the first quarter of 2026
02/05/2026
Vellfire Sedan gets rear diffuser and returns to the track in preparation for Toyota event
02/05/2026