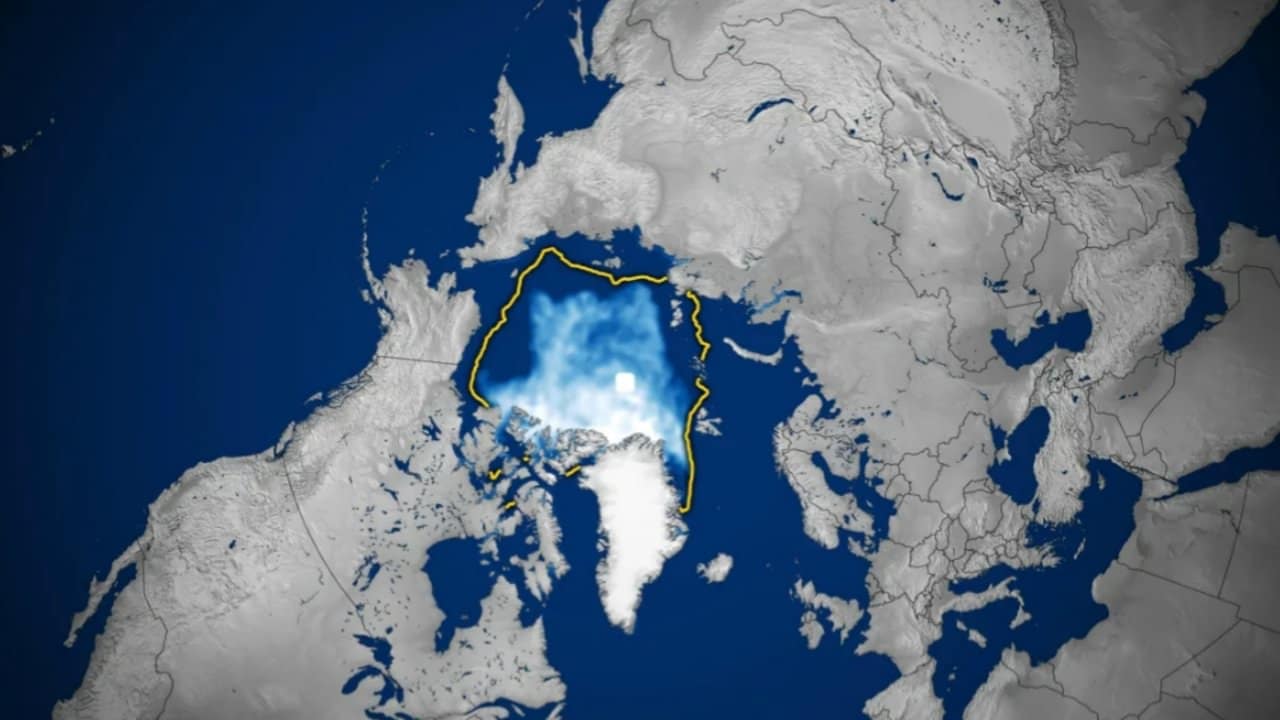
Satellite observations analyzed by the National Aeronautics and Space Administration (NASA) and the National Snow and Ice Data Center (NSIDC) in October 2026 show that Arctic sea ice retreated to an annual minimum extent of 4.60 million square kilometers (1.78 million square miles) on September 12, 2026. Following the summer melt season, the frozen surface of the northern polar ocean settled into a four-way statistical tie with the years 2008, 2010, and 2025. Across nearly five decades of continuous space-based monitoring, this measurement ranks as the 10th smallest summer ice cover ever documented.
Throughout the full month of September 2026, the average frozen surface across the Arctic basin measured 4.81 million square kilometers (1.86 million square miles), placing 13th lowest for that specific month in the satellite archive. Compared against the 30-year climatological baseline recorded between 1981 and 2010, the September 2026 monthly average fell short by 1.6 million square kilometers (618,000 square miles). Researchers at the NSIDC determine daily and monthly sea ice extent by applying five-day running averages to satellite imagery and counting every ocean grid cell where frozen water covers at least 15% of the surface, while treating variations of up to 40,000 square kilometers as statistical ties.
Separate operational tracking by the U.S. National Ice Center (USNIC), which relies on the higher-resolution Multisensor Analyzed Sea Ice Extent (MASIE) product and integrates multiple satellite sources with human analyst interpretation over a three-day running average, recorded a minimum of 4.77 million square kilometers (specifically 4,773,814 square kilometers) centered on September 14, 2026. That operational figure stood 174,000 square kilometers, or 3.8%, higher than the passive-microwave index maintained by the NSIDC, reflecting methodological differences between long-term climate records and daily navigational charts.
Walt Meier, a senior research scientist at the NSIDC based at the University of Colorado Boulder, stated that the 2026 readings confirm a fundamental and lasting structural shift across the northern polar cap. According to Meier, while the September 2026 minimum aligns closely with figures from recent years, it represents another low extent in a transformed Arctic and remains far smaller than any late-summer coverage observed during the 1980s, the 1990s, or the early 2000s.
Twenty lowest September ice extents all occurred after 2007
Continuous satellite tracking of the polar regions began in late 1978, establishing a clear baseline for the natural annual cycle in which Arctic ocean ice expands through the dark polar winter until peaking in March and melts back during the sunlit months until bottoming out in September. Over the nearly 48-year record, substantial losses have emerged at both the winter and summer extremes of the calendar. Every single summer over the 20-year span from 2007 through 2026 occupies one of the top 20 spots for the lowest September minimums on record, with the all-time historic low set in September 2012. Long-term climate assessments from 1979 through 2025 demonstrate that late-summer ice cover has contracted at an average rate of 11.9% per decade relative to the 1981–2010 average, shedding roughly 78,000 square kilometers (30,000 square miles) of ice—an area nearly the size of the U.S. state of South Carolina—each year.
Despite this long-term downward trajectory, the pace of summer ice loss has flattened out over the past decade, keeping September measurements relatively steady compared to the steep plunges documented during the 2000s. Scientists caution that this recent plateau does not point to a recovery of the polar ice cap, but rather reflects temporary seasonal balances driven by short-term weather patterns. Between June and August 2026, even as global air temperatures hovered near or at record highs and regions like Siberia and the Canadian Archipelago experienced warm conditions, the air directly over the high-latitude Arctic Ocean remained relatively cool. Frequent summer storms and dense cloud cover shielded the ocean surface from direct sunlight, slowing down additional melting after the ice pack had tracked near 2012 levels earlier in the season.
Read also: NASA Curiosity rover sparks pareidolia debate after capturing pyramid rock on Mars surface
Even with cooler local air braking the overall loss of area, the physical structure of the ice pack drew scrutiny from polar researchers due to a pronounced lack of compaction in the Atlantic sector. Instead of forming a solid, impenetrable barrier, dispersed and patchy blocks of ice stretched all the way to the top of the world, opening navigable channels that allowed the Swedish icebreaker Oden to sail directly to the North Pole.
Mark Serreze, director of the NSIDC, noted the unusual nature of the 2026 melt season in the agency’s assessment. Serreze pointed out that it had been a strange year in which the region logged only the 10th smallest extent on record, yet featured loose, unconsolidated ice all the way to the North Pole despite reasonably cool summer weather over the Arctic Ocean.
Decline of multiyear ice and simultaneous winter lows at both poles
Beyond the contraction in horizontal surface area, spatial data visualizations compiled by Michala Garrison at the NASA Earth Observatory highlight a critical degradation in both the age and thickness of the frozen canopy. In previous decades, a vast portion of the Arctic basin was armored by multiyear ice—thick, resilient floes that survive at least one summer melt season and continue hardening over several consecutive winters. By October 2026, that older ice had retreated to narrow strips hugging the northern coast of Greenland and areas immediately adjacent to the pole, leaving levels of ice older than four years at just 5% of what they were during the 1980s. In its place, the Arctic Ocean is now dominated by fragile first-year ice that freezes during a single winter season and melts rapidly as soon as spring temperatures rise.
This structural weakening is equally evident during the freezing season, when polar ice reaches its annual maximum footprint. On March 15, 2026, the Arctic winter peak statistically tied the mark set in March 2025 for the lowest winter maximum ever recorded in the satellite era. Meanwhile, in the Southern Hemisphere, where seasonal cycles are reversed, Antarctic sea ice reached its annual winter maximum extent on September 14, 2026, after undergoing an unusually large mid-winter decline over a single week in August. The southern ice pack topped out at 17.59 million square kilometers (6.79 million square miles), marking the third lowest winter maximum in the Antarctic satellite record.
- September 12, 2026 Arctic minimum extent: 4.60 million square kilometers (1.78 million square miles), tied with 2008, 2010, and 2025 for 10th lowest on record.
- September 2026 Arctic monthly average: 4.81 million square kilometers (1.86 million square miles), ranking 13th lowest for the month and 1.6 million square kilometers (618,000 square miles) below the 1981–2010 baseline.
- March 15, 2026 Arctic winter maximum: Statistically tied with March 2025 for the lowest winter peak in the satellite archive.
- September 14, 2026 Antarctic winter maximum: 17.59 million square kilometers (6.79 million square miles), the third lowest maximum in Southern Hemisphere history.
Commenting on the conditions in the Southern Ocean, NSIDC senior research scientist Ted Scambos emphasized the persistent sluggishness of the southern freeze. Scambos explained that throughout the 2026 growth season, Antarctic sea ice consistently lagged behind its long-term historical average.
Keep reading: NASA rover captures panoramic dawn image over Martian cliffs
Passive-microwave satellite tracking and projections through 2050
Natural atmospheric fluctuations, such as the Arctic Oscillation—a shifting pattern of atmospheric pressure and winds that alters regional temperatures and ice drift—continue to cause year-to-year variations in the volume of frozen ocean water. However, climate researchers emphasize that natural variability alone cannot account for the sustained four-decade decline documented since late 1978. When combining natural climate cycles with the ongoing rise in global temperatures, scientists project that the Arctic Ocean could experience a summer essentially free of sea ice at least once before the middle of the 21st century, prior to the year 2050.
To measure polar ice accurately through thick cloud cover and the continuous darkness of the polar night, space agencies rely on passive-microwave sensors mounted aboard Earth-observing satellites. These instruments detect weak microwave energy emitted naturally by the Earth’s surface, allowing algorithms to distinguish between open liquid seawater and frozen sea ice based on their distinct thermal and radiative signatures. The continuous climate record began in late 1978 with the launch of NASA’s Nimbus-7 spacecraft and continued from 1987 onward through sensors aboard the U.S. Department of Defense’s Defense Meteorological Satellite Program (DMSP) fleet, supplemented between 2002 and 2011 by NASA’s Aqua satellite. Beginning in 2025, the NSIDC and NASA integrated observations from the Advanced Microwave Scanning Radiometer 2 (AMSR2) aboard the GCOM-W1 satellite—also known as SHIZUKU—operated by the Japan Aerospace Exploration Agency (JAXA).
According to technical documentation published on October 7, 2026, by the NSIDC and the NASA Earth Observatory, satellite-derived polar maps display a small white circle directly over the North Pole, known in remote-sensing terminology as the pole hole. This circular gap represents a zone that lies beyond the orbital inclination and viewing angle of historical satellite sensors; to maintain consistency across the multi-decade dataset when calculating total sea ice extent, scientists assume that the ocean surface inside this polar circle remains completely covered by ice.